Drivers pick the station by what is next door
Paren studied 4,105 DC fast charging stations at 100 kW or above and found the median site running 9 sessions a day, grocery-adjacent sites running 42, and sites with nothing within walking distance running 3. A 100 kW session takes 25 to 40 minutes, which is what a grocery run takes, so the low numbers at most sites measure whether people will wait in a parking lot for half an hour and tell you very little about EV demand in that trade area.

Paren studied 4,105 DC fast charging stations rated at 100 kW or above, all of them active in the fourth quarter of 2025, drawn from 11 open networks including Electrify America, EVgo, ChargePoint, IONNA, and Electric Era. The median station in that set ran 9 charging sessions a day. Stations sitting next to a grocery store ran 42. Stations with no amenity within walking distance ran 3.

Grocery-adjacent stations are 6.7% of the sample.
A 100 kW session takes 25 to 40 minutes, which is what a grocery run takes. The driver is not choosing a charger in that situation, the driver is choosing 30 minutes that already had a use, and the charging happens because the errand was going to happen anyway. Shopping malls came in at 35 sessions a day across 3.7% of stations, and pharmacies at 37. Stations with 11 or more amenities within walking distance ran 28.
This changes what a low utilization number means. A site running 3 sessions a day reads as weak demand in that trade area, and the read is wrong, because what that site measured was whether people will stand in a parking lot for half an hour with nothing to do. Networks make expansion decisions from those numbers, and the decisions inherit the error.
I have to be careful with the size of the claim. Paren also reports that stations scoring 90 or above on its reliability measure run a median of 17 sessions a day while stations below 90 run 3, and the published analysis does not hold reliability constant while comparing amenity categories. Grocery-adjacent sites may be newer and better maintained on average. I cannot tell you from the published data how much of the 42 belongs to the groceries and how much belongs to the chargers working, and anyone citing this study should say the same.

Dealership chargers ranked last.
Dealerships scored 570 out of 1,000 in J.D. Power's 2026 Electric Vehicle Experience Public Charging Study, released August 12, and that is the lowest of any location type the study measures. Across the other categories, hotels scored 692, gas stations and convenience stores 689, restaurants 688, and stand-alone parking lots and garages 606. Overall DC fast charging satisfaction rose 12 points to 666 while charger availability gained 27 points and the non-charging failure rate fell to 12%, so the dealership number arrived in a year when nearly everything else in public charging improved.
A dealership lot at 7 p.m. on a Sunday has a locked showroom, no public restroom, and nothing within walking distance, which leaves the driver in the same position as the sites running 3 sessions a day. At the hour when most public charging happens, a hotel lobby is open and a service department is closed.
Most of these stalls went in to support vehicle sales, and drivers who arrive with no relationship to the store are grading them as public infrastructure. A dealer who wants the stalls to earn their footprint has 2 usable options: move them where a waiting service customer can walk to food, or stop selling public sessions and carry the cost inside fixed operations as a service drive asset. For a dealer already watching warranty work leave the bay, a charger nobody chooses is the same problem in a different part of the property.

Somebody has to pay for this fun.
The networks growing fastest right now are the ones that either own the retail or brought a retailer inside the deal. IONNA passed 100 operational sites with close to 1,000 live bays on March 17, opened a second automated convenience store using Amazon's Just Walk Out technology in Dallas, and is expanding with Casey's and Wawa. It has committed 250 million dollars to California over 3 years, holds roughly 4,000 contracted bays nationally, and is targeting 30,000 charging points by 2030.
Pilot reached 301 charging locations with about 1,300 stalls in the first half of 2026, up 50% from just over 200 locations in September 2025, at travel centers that already carry restaurants, groceries, restrooms, and lit parking.
A canopy, a restroom, and a lit lot cost money and give up parking area, which is why the site host has to be a party to the economics instead of a landlord collecting rent. The lease structure is the product decision. Networks that treat the host as a real estate counterparty end up with the 3-session sites, because a landlord optimizing for rent per square foot will put the stalls at the back of the lot every time.

Where next?
Watch the 6.7%. If capital is moving toward the format that performs, grocery-adjacent penetration rises in the next station-level release, and the industry is acting on what it learned. If that number holds flat while deployment keeps growing, then the constraint is real estate access and lease terms, and everyone already knows what works without being able to buy it.
The figure nobody has published is the host's side. No grocery chain has released what a charging canopy does to basket size, trip frequency, or dwell time in the store, and that number would settle the leasing question in an afternoon. Until a retailer publishes it, networks are asking grocers to give up 8 parking spaces on faith, and grocers are saying no for reasons they cannot quantify either.
For fleet operators the same arithmetic runs in reverse. A depot has no walk-up amenity requirement because the driver is on the clock and the vehicle charges overnight, so depot siting turns on power availability and the shape of the duty cycle. Fleets evaluating public charging as backup should price those sessions against the 3-session sites, since those are the ones with stalls open when a vehicle needs them.
SOURCES: Paren, "Where EV Drivers Charge: What 4,105 Stations Reveal About Retail Location and Performance," published June 1, 2026, for station counts, sessions per day by amenity category, station penetration percentages, the 25 to 40 minute charging window, and the reliability score comparison (paren.app); J.D. Power 2026 U.S. Electric Vehicle Experience (EVX) Public Charging Study, released August 12, 2026, for DC fast charging satisfaction scores, year over year changes, satisfaction by location type, and the non-charging failure rate (jdpower.com); Mobility Plaza, March 17, 2026, for IONNA site and bay counts, the Amazon Just Walk Out store in Dallas, and the Casey's and Wawa partnerships; IONNA press release, November 20, 2025, for the California investment, contracted bay totals, and the 2030 target; InsideEVs, 2026, for Pilot charging location and stall counts and the comparison to September 2025.
More from the AMA team.
 Newsletter
The Electron Highway
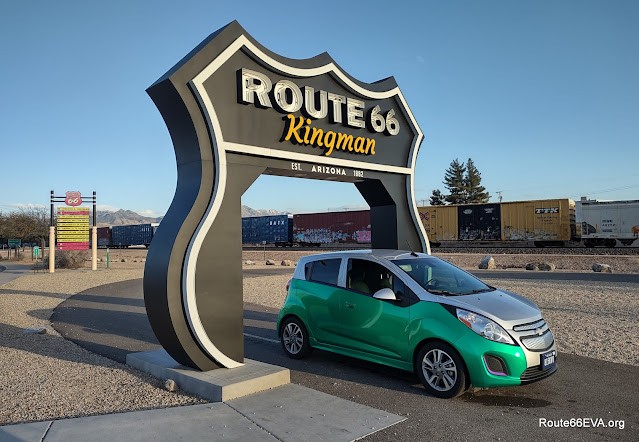
Traveling cross country in an EV was a concept thought impossible 10 years ago. Recently, part of the AutoMobility Advisors team drove from Tennessee to Massachusetts and back, observing charging stations across the Mid-South, Atlantic Coast, and New England regions of the Eastern US.
George Ayres · May 22, 2023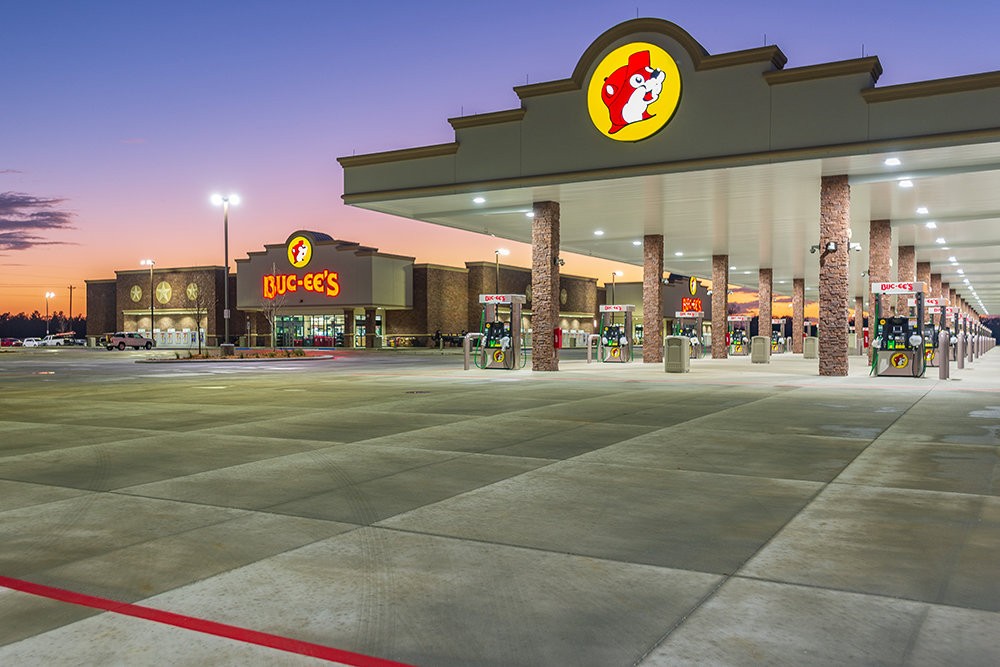 Newsletter
Waiting for to Go!
Part three of a three part series on the development of EVs and their supporting infrastructure in the United States: how the industry can fill the idle time created by extended EV charging sessions.
George Ayres · Apr 24, 2023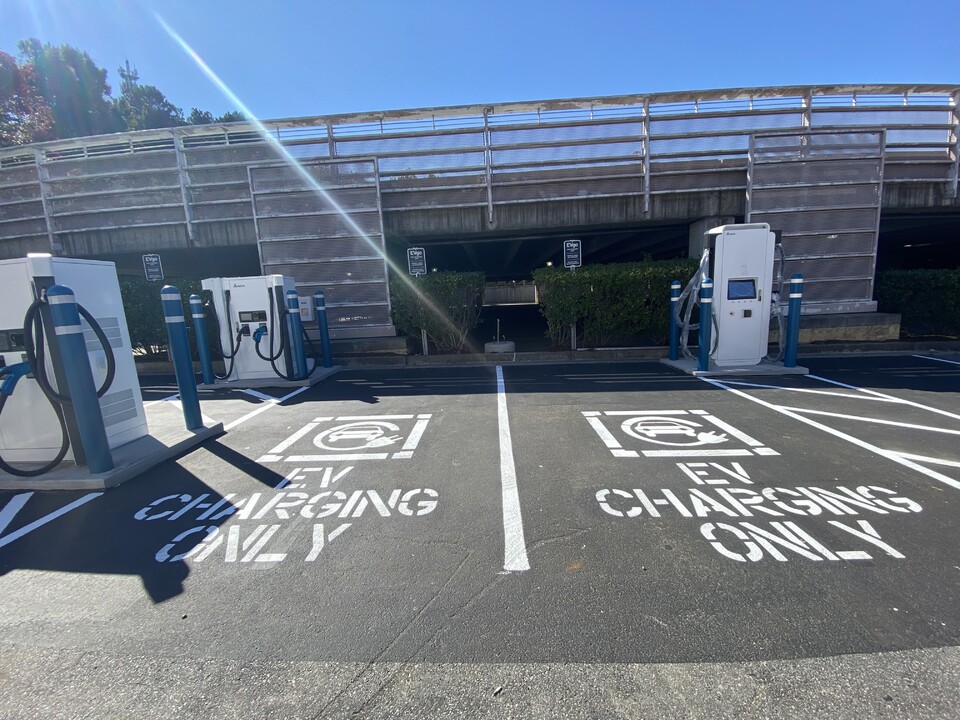 Newsletter
The Weakest Link
This is part two of a three part series on the development of EVs and their supporting infrastructure in the United States.
George Ayres · Mar 27, 2023
Talk to us about what you want to accomplish
Schedule 20-minutes with AMA. We will use the time to understand what you are trying to accomplish and how AMA can help.